
If you want one free meter that covers the most everyday checks, start with Voxengo SPAN. Add Youlean Loudness Meter when delivery loudness and true peak are the question, TDR Prism when you need to see masking or compare a reference, and Voxengo Correlometer when stereo phase is the concern. These tools are not eight versions of the same plugin. Each answers a different monitoring question, and choosing by that question is more useful than filling the master bus with overlapping graphs.
Free metering plugins compared by diagnostic task
| Question | Free plugin | What it shows | Current compatibility note | Do not expect it to |
|---|---|---|---|---|
| How loud is the program, and where are true peaks? | Youlean Loudness Meter | Free integrated loudness, loudness range, true peak, PLR and DR readouts, with loudness and true-peak graphs | Windows and macOS; application, VST2, VST3, AU and AAX | Decide the correct delivery target without a platform specification |
| Where is the spectral energy, and are levels or correlation suspicious? | Voxengo SPAN | FFT spectrum, level statistics, EBU R128/K-system views, true-peak clipping and correlation | 64-bit Windows and macOS; VST/VST3/AU/AAX families vary by OS | Tell you whether a tonal choice is musically right |
| Which frequencies may be masked, and how does a reference differ? | TDR Prism | Perceptual spectrum, auditory masking and source comparison | Windows, macOS and Linux; available formats vary by OS | Replace listening-level matching or arrangement decisions |
| How do RMS, crest factor, loudness and dialog measurements relate? | TBProAudio dpMeter5 | RMS, EBU R 128, dialog-gated, true-peak, crest and loudness-range views | Windows and macOS; current developer downloads list common plugin formats | Run DIAL measurements at sample rates other than 44.1 or 48 kHz |
| Do I need a spectrum analyzer with detailed display controls? | MeldaProduction MAnalyzer | Spectrum, normalization, smoothing, prefiltering, deharmonization and integrated level meters | Included in the current MFreeFXBundle | Provide every paid resize, preset and sonogram feature in the free tier |
| Can I get a simpler real-time spectrum display? | Blue Cat FreqAnalyst | Mono/stereo spectrum, smoothing, zoom and threshold controls | Windows and macOS in VST/VST3/AU/AAX families | Include the Pro edition’s curve storage, precision tools or 3D spectrogram |
| Can I check level, loudness and M/S without a large analysis suite? | HOFA 4U Meter, Fader & MS-Pan | Peak, hold, EBU, loudness range, M/S and file analysis | PC and Mac; verify the current installer because the page retains legacy format wording | Replace a dedicated spectrum or phase-analysis tool |
| Is the stereo problem limited to part of the spectrum? | Voxengo Correlometer | Correlation across 4–64 bands, phase-risk cues and sidechain comparison | 64-bit Windows and macOS; VST/VST3/AU/AAX families vary by OS | Prove that width, polarity or timing is correct by itself |
The recommendations below group tools by the measurement tasks described in their product pages and documentation; they are not an installation, benchmark or accuracy ranking.
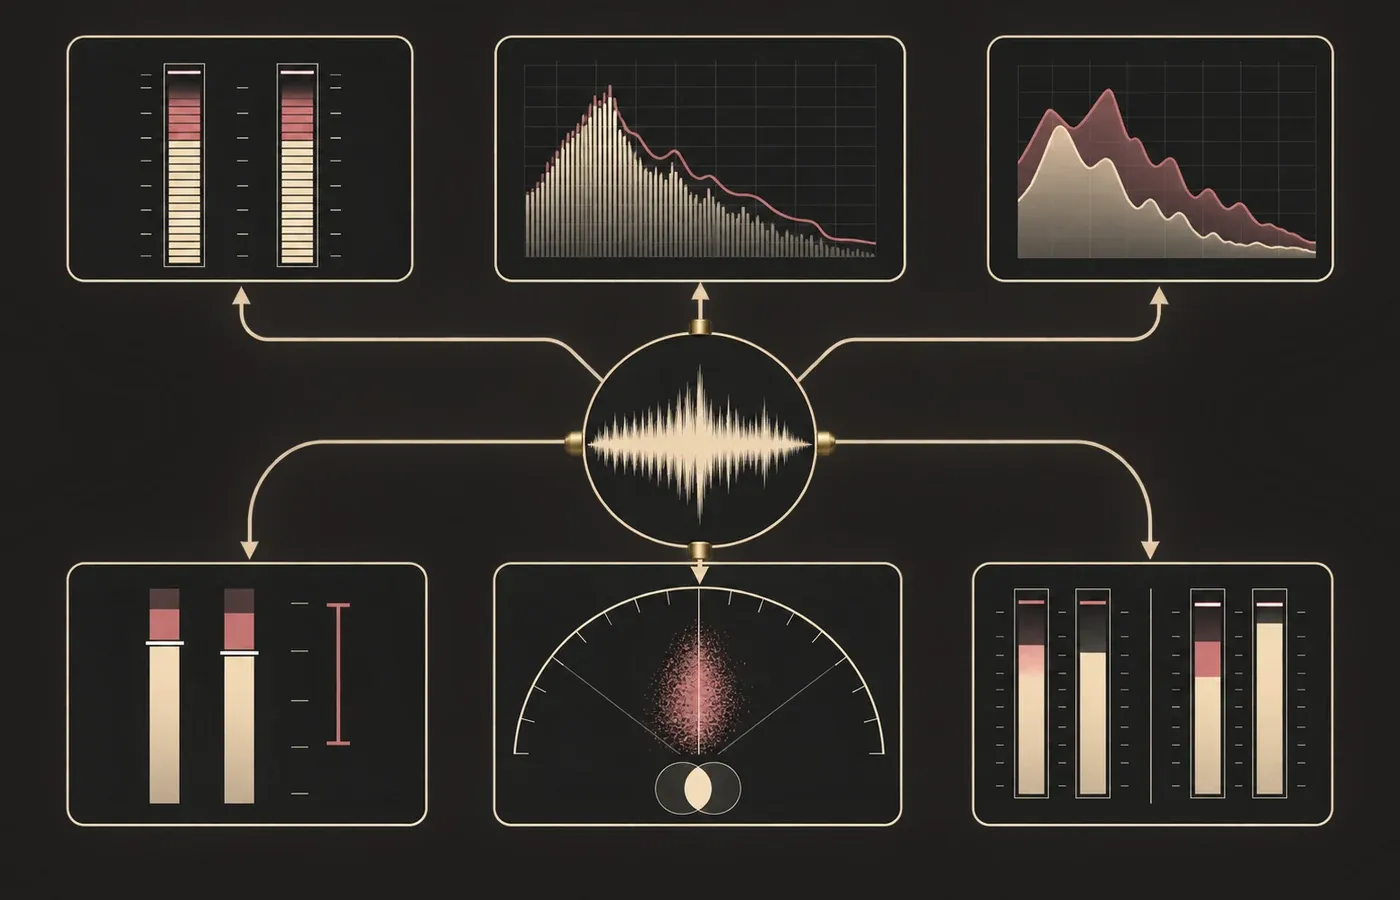
Loudness, spectrum, masking and correlation answer different questions
A meter becomes useful only after you can finish the sentence: “I need to know whether…” A loudness meter can show program loudness and true peak, but it cannot explain a harsh upper midrange. A spectrum analyzer can show where energy accumulates, but it cannot decide whether that energy belongs there. A correlation meter can warn about possible mono loss, but a positive reading is not a quality certificate.
Loudness and true peak
Use these readings when a broadcaster, podcast host or other destination gives a measurable delivery specification. If you need a quick browser check before opening a DAW, the SoundForgePro LUFS meter covers that separate task.
Spectrum
Use a spectrum view to locate persistent low-end buildup, narrow resonances or missing regions. The browser audio spectrum analyzer explains the FFT view without turning the graph into an automatic EQ instruction.
Perceptual comparison
Use masking and reference overlays to ask whether one source hides another or whether two spectra differ. Match playback level before treating a brighter or louder reference as better.
RMS and crest factor
Use level history and crest factor to describe the relationship between average and peak behavior. They are clues about dynamics, not targets that every genre must share.
Correlation and mono compatibility
Use correlation to find frequency regions that may cancel when summed. The full mono-compatibility and phase-correlation guide owns the corrective workflow.
Peak, hold and M/S
Use compact meters for gain staging, mid/side balance and fast file checks when a full spectral display would add noise rather than information.
1. Youlean Loudness Meter: start here for loudness and true peak
Youlean is the clearest first addition when the destination gives you a loudness or true-peak requirement. The current Youlean product page describes loudness, loudness range, dynamics and true-peak measurement and lists Windows and macOS application, VST2, VST3, AU and AAX options.
The free edition includes integrated loudness, true peak, loudness range, PLR and DR readouts, plus loudness and true-peak graphs. It supports mono, stereo and 5.1 audio and does not expire. I would start there for delivery checks. Pro adds streaming presets, a dynamics graph, PDF/PNG/SVG exports, custom presets, A/B states and drag-and-drop analysis; you do not need those extras just to read integrated loudness and true peak.
2. Voxengo SPAN: the most useful general-purpose starting point
SPAN is my default recommendation when someone asks for “a free meter” but has not yet narrowed the problem. According to the official SPAN page, it combines an FFT spectrum analyzer with stereo, mono and mid-side views, level statistics, true-peak clipping detection, EBU R128/K-system metering and stereo correlation. That breadth makes it a sensible first diagnostic panel.
The advantage is consolidation: one plugin can reveal a low-frequency concentration, a clipping concern and a suspicious correlation reading without opening three windows. The danger is assuming one window gives one answer. Read each section independently and follow the clue with the relevant listening or mono check.
3. TDR Prism: best for masking and reference comparison
Prism earns its place because it asks a more useful question than “what does the spectrum look like?” The TDR Prism documentation describes perceptual weighting, human auditory filters, real-time masking indication and comparison between regular inputs, sidechains, audio files and other Prism instances. That makes it especially relevant when two sources compete or a reference seems different but the cause is unclear.
Reference comparison still needs level discipline. A louder reference often appears fuller and clearer before any spectral judgment begins. Prism can show the difference; it cannot remove the bias created by mismatched playback level or tell you whether an arrangement should leave more space.
4. TBProAudio dpMeter5: best for dynamics and dialog-oriented readings
dpMeter5 is the stronger choice when the question includes RMS, crest factor or dialog-gated measurements rather than only integrated loudness. The current dpMeter product page lists RMS, EBU R 128 and DIAL modes, along with integrated, momentary, peak, true-peak, loudness-range and crest readings.
For dialog work, check the session sample rate first: the dpMeter5 manual limits DIAL measurements to 44.1 and 48 kHz. This restriction applies to DIAL mode, not to every measurement in the plugin. Choose a dialog-gated reading only when your delivery requirement calls for it; a music mix and a dialogue program may need different measurements.
5. MeldaProduction MAnalyzer: detailed spectrum work with a free-tier caveat
MAnalyzer is a broad spectral tool for readers who want more than a simple curve. The official MAnalyzer page documents smoothing, normalization, super-resolution, prefiltering and deharmonization, along with spectrum analysis and integrated peak and loudness meters. Sonogram access requires the paid MFreeFXBundle upgrade.
Two limits matter. First, Melda’s page still describes its loudness meter as EBU R128 and ITU-R BS.1770-3 compliant, so that is the revision to report. Second, the MFreeFXBundle comparison says paid activation adds resizing, preset management and sonogram access in analyzers and equalizers. Do not assume the product headline means every displayed feature is available without the upgrade.
6. Blue Cat FreqAnalyst: a simpler real-time spectrum view
FreqAnalyst fits the opposite preference: a focused spectrum display without the broader metering stack. Blue Cat describes the free FreqAnalyst as a mono and stereo real-time spectrum analyzer with control over frequency transformation, smoothing, zoom and thresholds, available for Mac and Windows in common plugin formats.
The same page clearly separates the Pro edition. Saving and restoring curves, precise measurement tools, a 3D spectrogram and related advanced functions are not safe claims for the freeware version. If your question is simply “where is the energy?”, that limitation may be useful: fewer controls can make the first diagnosis faster.
7. HOFA 4U Meter, Fader & MS-Pan: quick level and M/S checks
HOFA’s 4U utility is useful when you want a compact channel tool rather than another large graph. The current HOFA freeware page describes peak and hold metering, EBU readings, loudness range, M/S encode/decode, stereo/mono switching and drag-and-drop file analysis.
The page lists Audio Unit, VST, VST3 and AAX formats and retains both 32- and 64-bit DAW wording. Treat that as a reason to check the actual installer for your current OS and host before planning a session around it. The feature fit is clear; the compatibility sentence should stay cautious.
8. Voxengo Correlometer: best for multiband stereo correlation
Correlometer is the specialist in this group. The official Correlometer page documents correlation metering across 4 to 64 bands, phase-issue detection, mono-compatibility checking and sidechain support. A broadband meter may look acceptable while a narrower frequency region cancels; the multiband view is designed to expose that distinction.
Correlation remains a clue, not a verdict. Negative or unstable bands deserve a mono sum and a routing check, but the display does not tell you whether the cause is an intended stereo effect, a polarity error, a timing offset or a harmless local feature. Diagnose the cause before narrowing the entire mix.
What the loudness standards do—and do not—tell you
ITU-R BS.1770-5 defines algorithms for measuring program loudness and true-peak audio level. EBU R 128-2023 uses program loudness for broadcast normalization, maximum true peak for the upper technical limit, and loudness range plus momentary and short-term measures to further characterize a program.
Those documents explain the measurement framework; they do not create one universal target for music, podcasts, broadcast and every streaming platform. Use the destination’s current rules. SoundForgePro keeps the changing delivery details in the separate streaming loudness standards guide and podcast loudness guide. If you are working specifically inside Sound Forge, the Sound Forge loudness-meter walkthrough covers that software-specific path.
A practical two-meter workflow
For a delivery check, establish the destination’s current loudness and true-peak requirements before choosing a meter or changing the audio. A preset is a convenience, not a substitute for those requirements.
- Name the failure you are checking.Clipping, delivery loudness, tonal buildup, masking and mono loss are different failures.
- Choose one primary meter.Use Youlean or dpMeter5 for delivery and dynamics, SPAN or FreqAnalyst for spectrum, Prism for masking, or Correlometer for phase.
- Add one secondary view only when it changes the decision.For example, pair a loudness meter with SPAN, or Prism with Correlometer. Avoid three spectrum analyzers showing the same clue.
- Confirm the graph with an audible check.Level-match references, sum to mono when phase is the issue, and bypass processing before accepting the meter’s implication.
- Verify the final delivery readings.For delivery work, compare the final readings with the requirements you established at the start.
Which free meter should you download?
Choose Voxengo SPAN. It covers spectrum, levels, true-peak clipping and a quick correlation view without forcing you into a single delivery workflow.
Choose Youlean Loudness Meter. The free edition covers integrated loudness, loudness range and true peak. Use your destination specification to set the target; streaming presets and export reports are Pro extras.
Choose TBProAudio dpMeter5. Choose the view required for your material; DIAL measurements require a 44.1 or 48 kHz session.
Choose TDR Prism. Level-match first so the comparison answers a spectral question rather than a loudness bias.
Choose Blue Cat FreqAnalyst. Choose MAnalyzer when you need a more configurable tool and accept the free-tier limits.
Choose Voxengo Correlometer. Follow suspicious bands with mono listening and routing checks instead of treating the graph as a pass/fail light.
Choose HOFA 4U Meter, Fader & MS-Pan, then verify that the current installer supports your OS and plugin host.
The useful free-meter setup is usually smaller than the download list. Pick the question, choose one tool that answers it, and add a second meter only when it covers a different problem. That keeps the screen readable and makes every measurement lead to a decision.