Sound Forge Pro Statistics: How to Check LUFS, True Peak and RMS

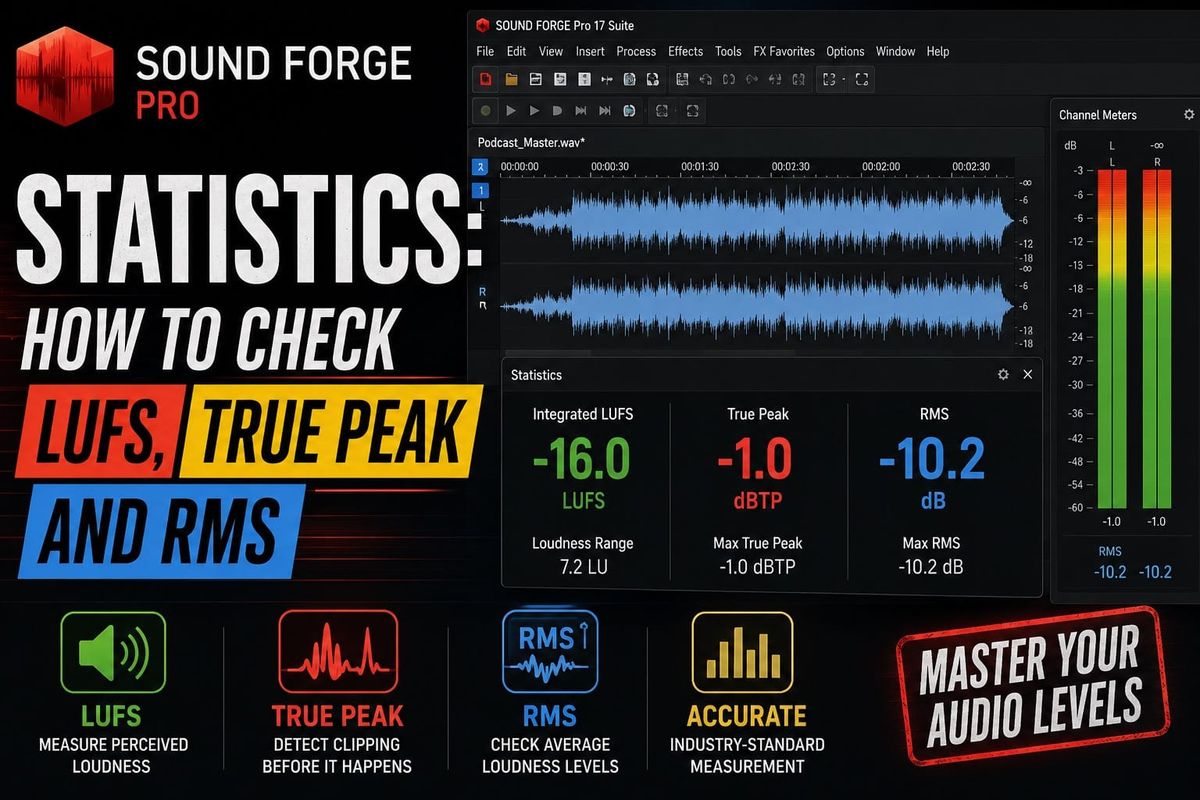
Statistics is Sound Forge Pro's non-real-time loudness and level analysis tool. It scans the entire active file — or a selected region — and returns integrated LUFS, true peak, loudness range, short-term loudness, momentary loudness, RMS level, minimum and maximum sample values, DC offset indicator, and zero crossings. All of this happens faster than real time: you don't sit through 40 minutes of playback to get the numbers for a 40-minute file.
Most people encounter Statistics in the mastering workflow — run it before touching the file to get a baseline, run it again after processing to verify the result. That before-and-after comparison is what makes the tool useful rather than just informational. If the integrated LUFS doesn't move the way you expected, or the true peak went somewhere you didn't intend, Statistics shows you exactly what happened.
Quick answer: Go to Tools → Statistics. Sound Forge scans the file and opens the Statistics dialog with all loudness and level measurements. Run it before mastering to record the baseline state, run it again after to verify. For mastering to a delivery spec, the integrated LUFS and true peak readings are the two numbers that matter most.
When to Use Sound Forge Pro Statistics
Use Statistics when you need a fixed loudness and level reading for a completed file, not a moving meter during playback. It is most useful at four points in a workflow: before mastering (to record the baseline state of the file), after normalization (to verify the result landed correctly), before exporting for streaming or broadcast delivery (to confirm the file meets the spec), and when checking whether a selected section contains clipping, excessive noise, or unexpected peak levels.
What it doesn't replace: real-time meters during a mixing or monitoring session. Statistics is a point-in-time analysis of a static file, not a live level indicator. Use the real-time LUFS meters during playback for monitoring; use Statistics for verification before committing to a final export.
How to Open Statistics
Go to Tools → Statistics. The dialog opens and immediately begins scanning the active file. On a typical mastering session file — a stereo WAV under five minutes — the scan completes in a few seconds. Longer files take proportionally longer but still scan faster than real time.
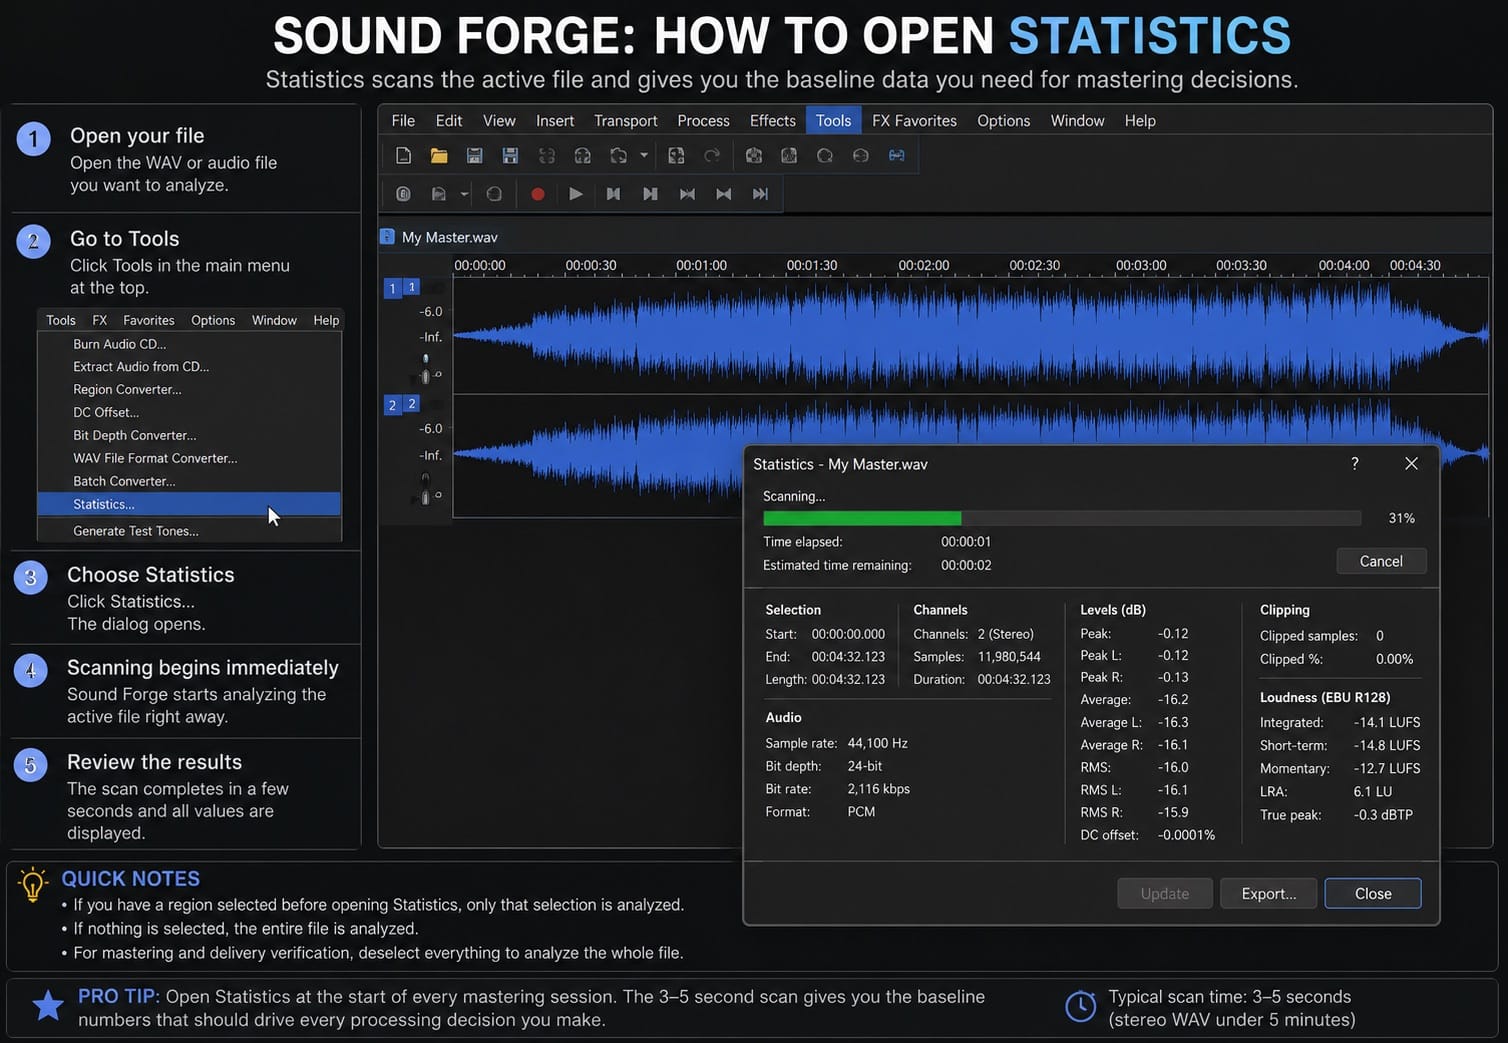
If you have a region selected before opening Statistics, the analysis runs on the selection only. If nothing is selected, it analyzes the entire file. The distinction matters when you're checking a specific section — a loud chorus, a problematic verse, a section with noise — rather than the whole file. For delivery verification, you almost always want the whole file, so deselect before running.
I open Statistics at the start of every mastering session before touching any controls. The scan takes three to five seconds on a typical stereo master, and the baseline numbers it gives me shape every decision that follows.
Older Sound Forge documentation confirms the path as Tools → Statistics; the Sound Forge Pro Statistics reference also describes the full list of fields the dialog returns.
What the Statistics Dialog Shows
The dialog is divided into sections. The top section shows sample-level measurements. The bottom section — introduced in later versions — shows the loudness measurements that matter for delivery.
An independent review in Sound on Sound described Statistics as performing "an offline analysis of the audio in the active edit window to provide values for integrated loudness, loudness range, true-peak and maximum short-term and momentary loudness." That is an accurate summary of what the dialog shows. The full reference is the Sound on Sound Sound Forge Pro 12 review.
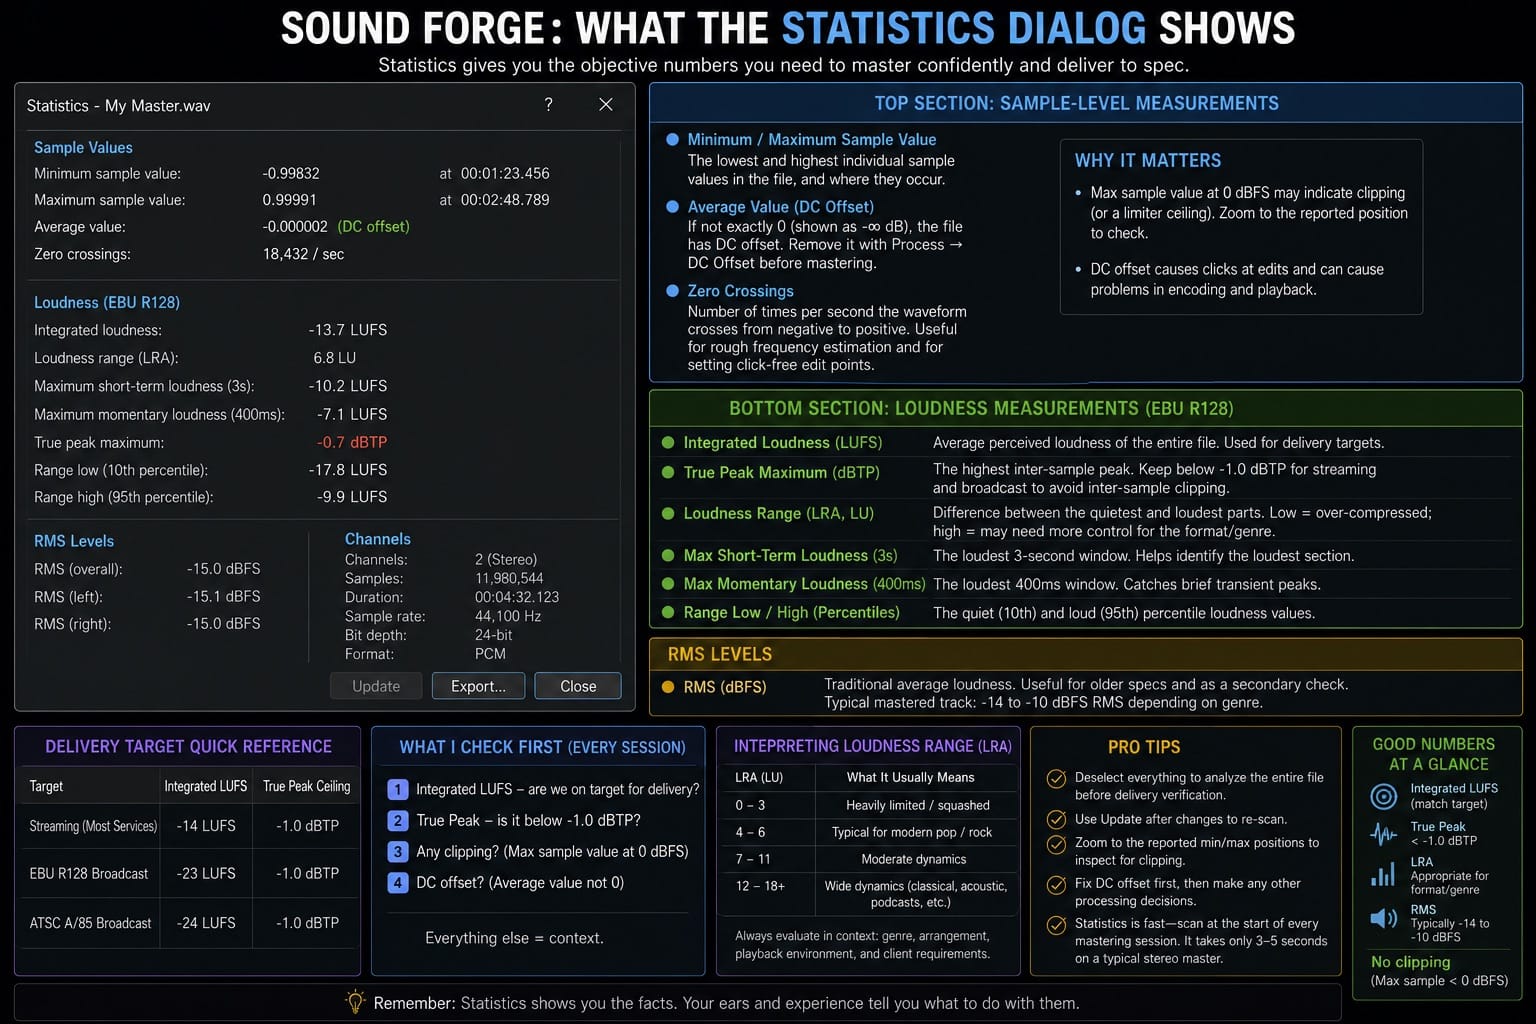
Integrated LUFS. The single most important number for modern delivery. Integrated loudness measures the average perceived loudness of the entire file, weighted across the full duration. This is the number that streaming platforms and broadcast specs target. For streaming, -14 LUFS is a common playback-normalization reference; EBU R128 broadcast is -23 LUFS; ATSC A/85 is -24 LUFS. If your integrated LUFS doesn't match the target for your delivery format, the file needs more or less gain before you export.
True Peak. The maximum inter-sample peak level in the file, expressed in dBTP. This measures the actual analog reconstruction peak rather than just the digital sample values — which is why true peak can be higher than the highest sample value shown in the waveform. For streaming delivery, true peak should stay below -1.0 dBTP. For broadcast delivery, -1.0 dBTP is also the standard ceiling. If Statistics shows true peak at 0.0 dBTP or above, the file has a serious risk of inter-sample clipping during playback, conversion, or lossy encoding.
Loudness Range (LRA). The difference in loudness between the quietest and loudest parts of the file, in LU. A heavily compressed pop track might have an LRA of 4–6 LU. A classical recording or podcast with natural dynamics might have 12–18 LU. If LRA is very low, the mix may be over-compressed. If it's very high for the genre or format, a final limiter pass might be needed. Some broadcast workflows define acceptable LRA ranges, but for music, LRA should be interpreted in context: genre, arrangement, playback environment, and client requirements matter more than one universal number.
Maximum Short-Term Loudness. The loudest 3-second window in the file. Useful for identifying the loudest section without listening through the whole recording.
Maximum Momentary Loudness. The loudest 400ms window in the file. Catches transient loud moments that integrated LUFS might mask because they're brief.
RMS Level. Root Mean Square — a traditional average loudness measurement that predates LUFS. Still useful as a secondary check and for formats or clients that specify RMS rather than LUFS. A typical mastered commercial track sits around -14 to -10 dBFS RMS depending on genre. The official documentation notes that RMS "is a more accurate measurement of loudness than the peak value."
Minimum/Maximum Sample Value and Position. The lowest and highest individual sample values in the file, with time positions where they occur. If the maximum sample value reaches 0 dBFS, the file is either touching the digital ceiling or may contain clipped samples. Zoom into the reported position in the waveform before assuming the damage is audible — a limiter ceiling and actual clipping distortion both show 0 dBFS in Statistics, but sound and look different in the waveform. The positions help you find the clipped region in the waveform without searching manually.
Average Value. The sum of all sample values divided by the number of samples. An average value that isn't exactly -∞ dB indicates a DC offset in the file — a static voltage shift that biases the waveform above or below zero. DC offset causes clicking at edit points and can cause problems in some encoding processes. If Statistics shows a non-zero average value, remove the DC offset with Process → DC Offset before doing anything else.
The numbers I check first every session: integrated LUFS and true peak. Everything else is context. LRA tells me whether the dynamics are appropriate for the format; RMS tells me whether older delivery specs are met; min/max sample values tell me whether there's clipping I need to address before anything else.
Zero Crossings. The number of times per second the waveform crosses from negative to positive. Primarily useful for rough frequency estimation on simple waveforms and for setting edit points — edits on zero crossings produce no click artifacts.
The Before and After Workflow
The correct way to use Statistics in a mastering session is in two passes: once before any processing, once after.
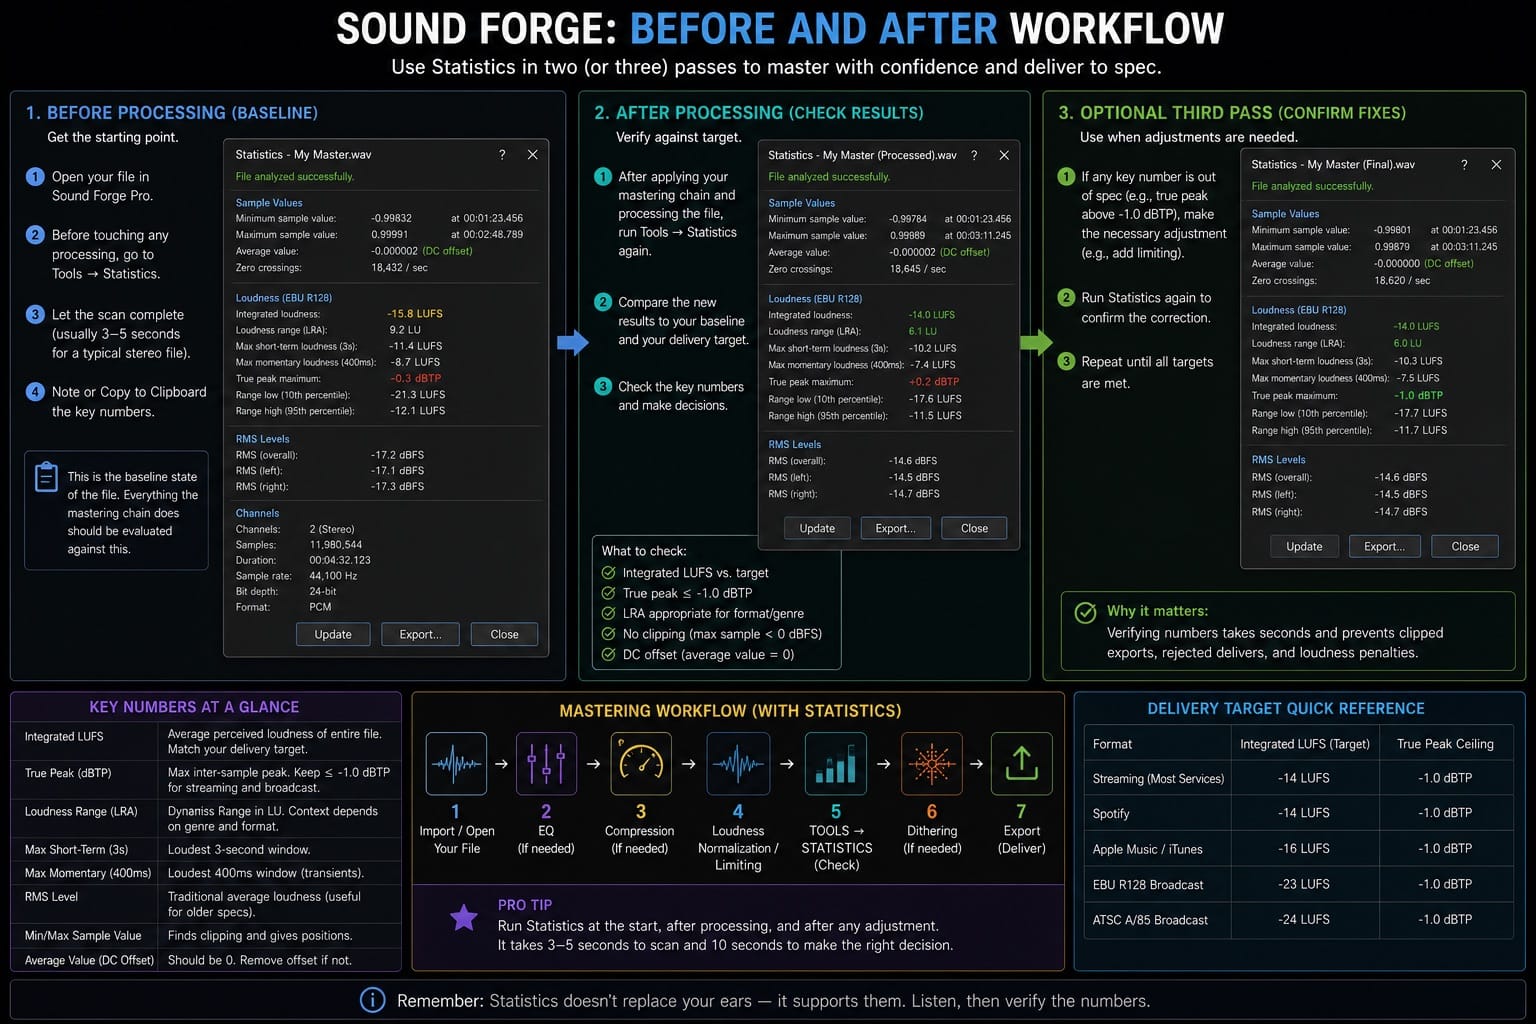
Before: Open the file in Sound Forge Pro. Before touching any EQ, compression, or normalization controls, run Tools → Statistics. Write down or Copy to Clipboard the integrated LUFS, true peak, and LRA. This is the baseline state of the file. Everything the mastering chain does should be evaluated against this baseline.
After: Once the mastering chain has been applied and the file has been processed, run Tools → Statistics again. Compare the new integrated LUFS against the baseline and against your delivery target. Check true peak against the -1.0 dBTP ceiling. Verify LRA is appropriate for the format.
On a typical mastering session, I run Statistics a third time if I've made adjustments after the first post-processing check — for example, if the first Statistics pass showed true peak at +0.2 dBTP, I apply a small amount of limiting to bring it under -1.0 dBTP, then run Statistics once more to confirm the correction landed correctly before export. The scan takes a few seconds; verifying the numbers takes ten more. It's the cheapest quality check in the mastering workflow.
The full mastering workflow sequence — EQ, compression, loudness normalization, Statistics verification, dithering, export — is in the mastering guide.
Using Statistics Before Normalization
The Normalize dialog (Process → Normalize) has a Scan Levels button that performs its own measurement pass, but Statistics provides a more complete picture before you decide which normalization mode to use. Running Statistics first tells you the integrated LUFS, which determines whether to use peak normalization, LUFS normalization, or a volume adjustment followed by Statistics verification.
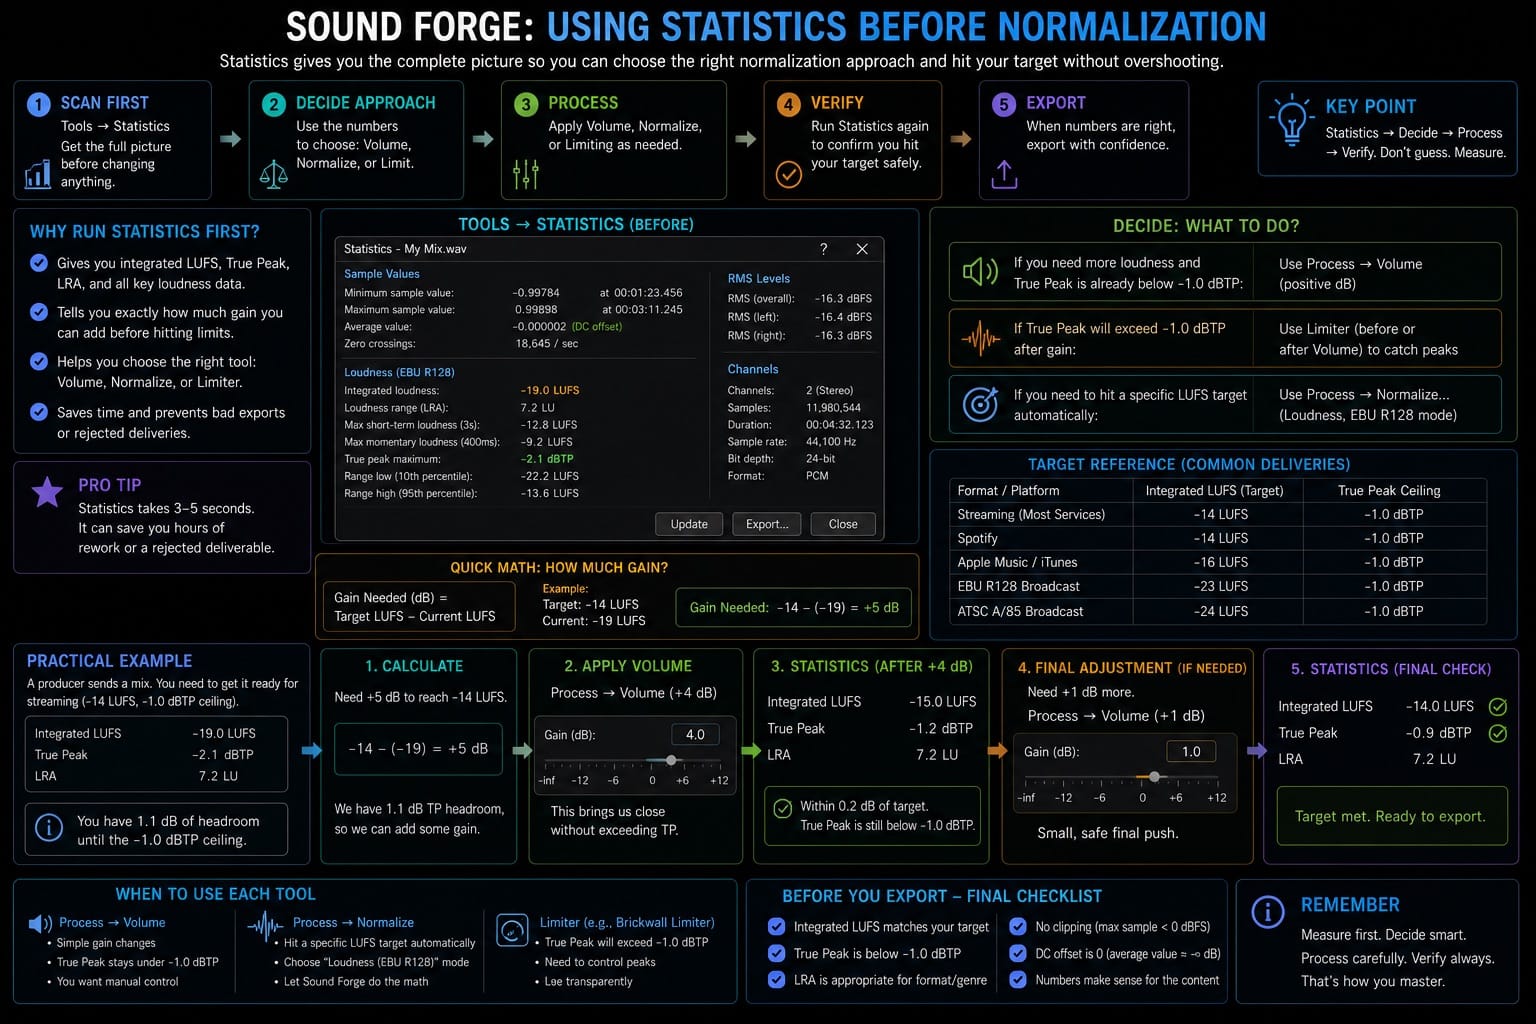
If the file is at -18 LUFS integrated and you want to reach -14 LUFS for streaming, the math is a 4 dB gain adjustment — achievable with Process → Volume (+4 dB) without any limiting. Run Statistics after to confirm the result landed at -14 LUFS with true peak under -1.0 dBTP. If the gain adjustment pushes true peak above -1.0 dBTP, you need a limiting pass before or after the volume adjustment. Statistics tells you whether that problem exists before you've already exported the file.
A common scenario: a producer sends a mix at -19 LUFS integrated, true peak at -2.1 dBTP. That tells me I have 1.1 dB of headroom to spare before hitting the -1.0 dBTP ceiling, and I need a 5 dB gain adjustment to reach -14 LUFS for streaming. Process → Volume (+4 dB) brings integrated LUFS to roughly -15 LUFS; another Statistics pass confirms whether that landing is close enough or whether a final small adjustment is needed. No limiting required because true peak stays under -1.0 dBTP after the gain. Statistics made that calculation possible in under 30 seconds.
The step-by-step mastering walkthrough that uses Statistics as the central verification step is in the how to master a track guide. The normalization workflow in detail — which mode to use, when to use each — is in the normalization guide.
Checking a Selection vs the Whole File
Statistics runs on the current selection if one is active, or the whole file if nothing is selected. This makes it useful for checking specific sections of a recording independently of the full-file numbers.
Practical uses for selection-based Statistics:
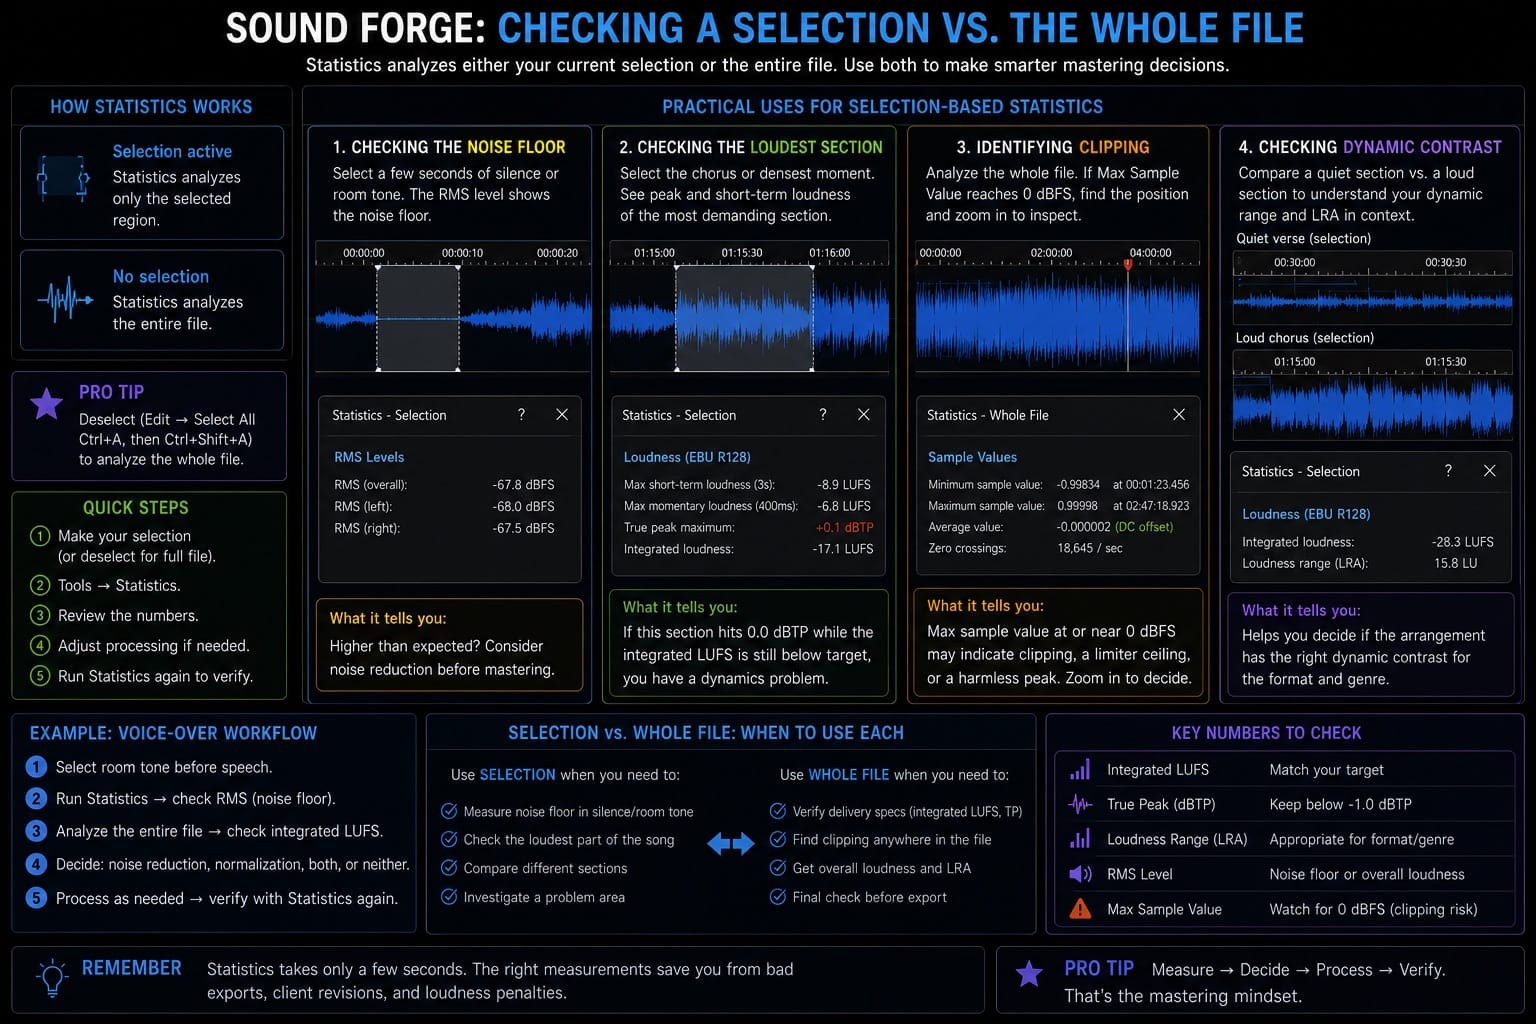
Checking the noise floor. Select a few seconds of silence or room tone at the start or end of the recording. Run Statistics. The RMS level of that selection gives you the noise floor of the file. If it's higher than expected, noise reduction may be warranted before mastering.
Checking the loudest section. Select the chorus, the loudest verse, or the densest moment in the track. Run Statistics on that selection to see the peak and short-term loudness of the most demanding section. If that section is already at true peak 0.0 dBTP while the integrated LUFS is still 3 dB below your target, you have a dynamics problem that limiting alone won't cleanly fix.
Identifying clipping. Select the entire file and run Statistics. If Maximum Sample Value reaches 0 dBFS, the file is touching the digital ceiling and may contain clipped samples. Zoom into the reported position before deciding whether it is actual clipping, a limiter ceiling, or a harmless peak. If the waveform shows flat-topped transients at that position, DeClipper is likely needed.
I use selection-based Statistics regularly on voice-over work — check the noise floor in the pre-speech room tone, then check the full file to see where integrated LUFS sits. The two numbers together tell me whether the file needs noise reduction, normalization, both, or neither before it goes to the client or onto the timeline. The voice-over processing workflow is in the voice-over guide.
Copy to Clipboard
The Copy to Clipboard button at the bottom of the Statistics dialog copies all displayed values as formatted text. This is useful for comparing before and after states in a text editor or spreadsheet, documenting the final measurements for a mastering session log, or sending the numbers to a client as verification of delivery compliance.
For album mastering sessions with multiple tracks, I run Statistics on each finished master, copy the results to a spreadsheet with one row per track, and use that as the session log. The integrated LUFS and true peak for every track in one place, timestamped. If a client comes back six months later with a question about a specific track, the numbers are there without needing to reopen Sound Forge and re-scan the file.
Statistics vs Real-Time Meters
My habit: real-time meters on during the mastering chain preview so I can hear and watch the chain behave dynamically. Statistics comes in at the end — one final scan before export to confirm the delivery numbers. The real-time meters show you what's happening moment to moment; Statistics shows you what the finished file actually is.
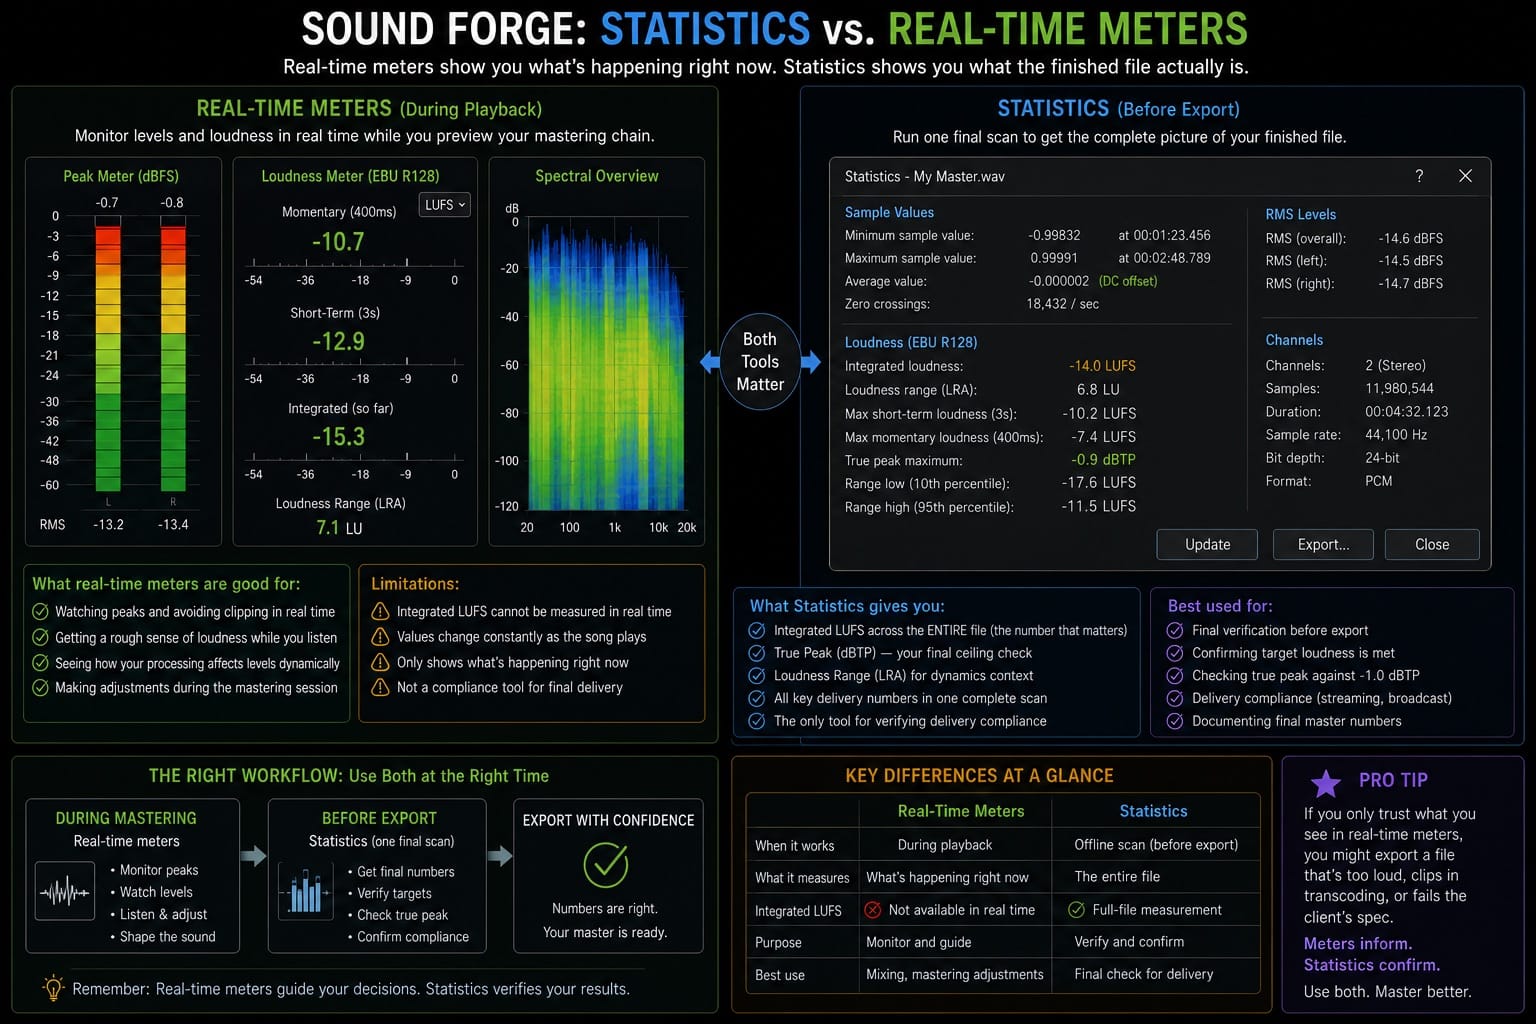
Sound Forge Pro also has real-time loudness meters that show LUFS and peak levels during playback. Statistics and the real-time meters serve different purposes.
The real-time meters are useful for monitoring levels during playback — watching for peaks, checking that the mix isn't clipping in real time, getting a rough sense of loudness during a listening pass. They don't give you integrated LUFS across the whole file because integrated LUFS requires analyzing the complete duration, not just what's playing at any given moment.
Statistics gives you the integrated LUFS across the complete file in a single scan. It's the tool for verification before export, not for monitoring during playback. For delivery compliance — confirming that the finished file meets a specific LUFS or true peak spec — Statistics is the correct tool. The real-time meters are informational during the session; Statistics is the final check before you close the file.
Statistics Values to Check Before Export
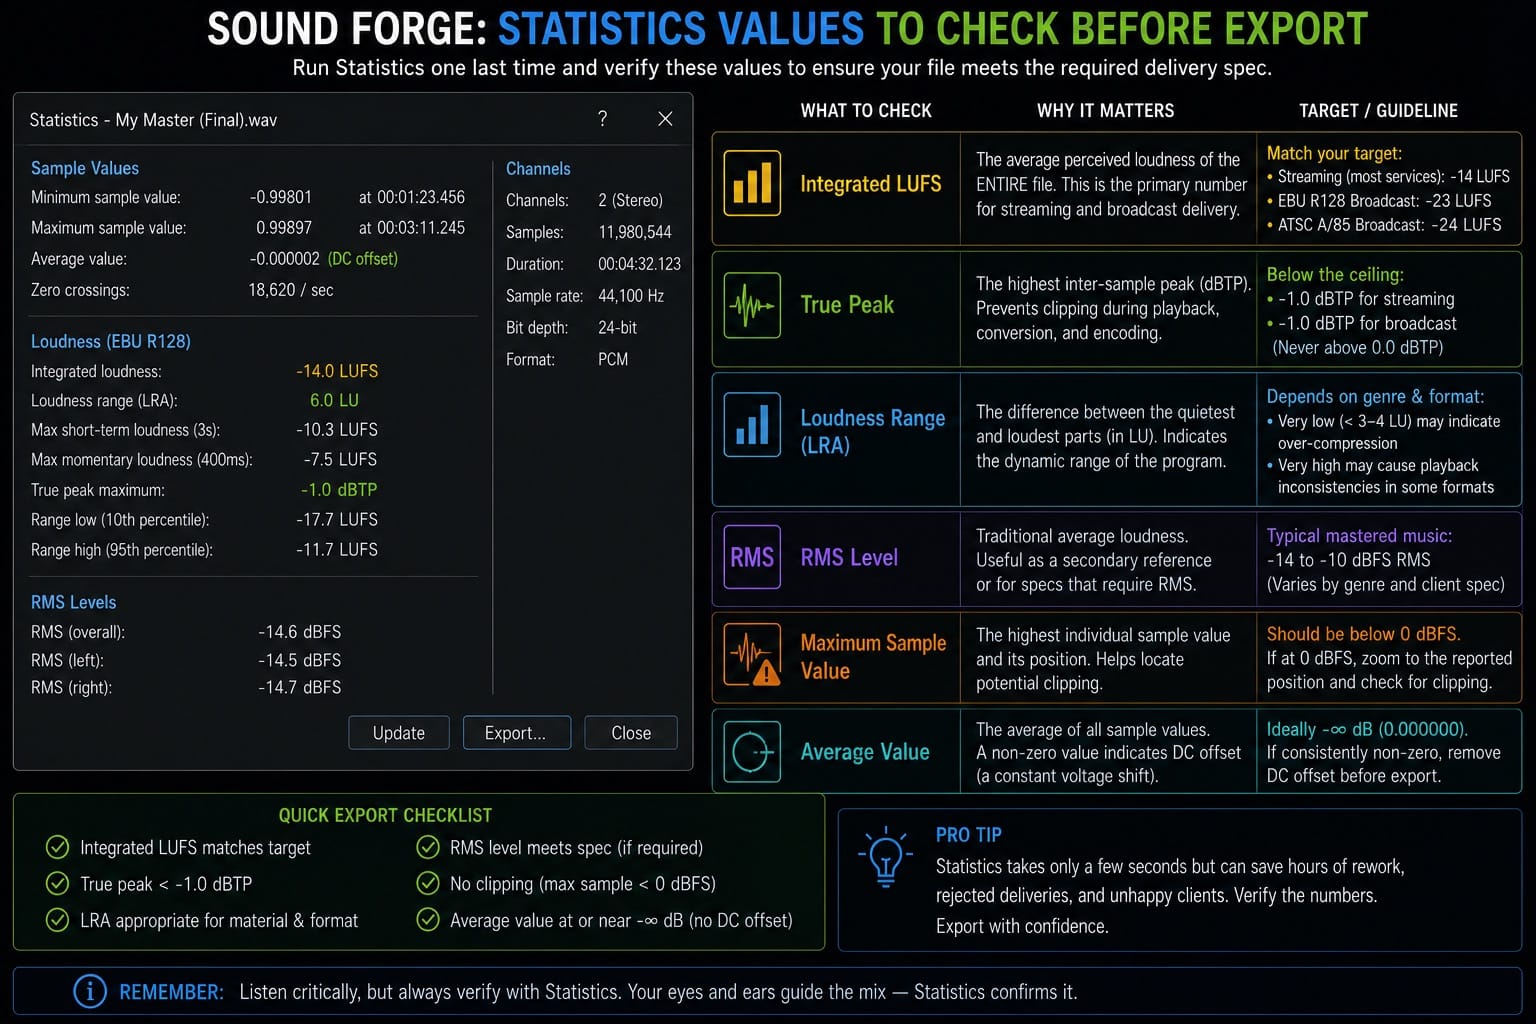
Before exporting the final file, run Statistics one last time and verify these values:
Integrated LUFS — close to the required delivery target for the platform or client spec.
True peak — safely below the ceiling required by the delivery format, typically -1.0 dBTP for streaming and broadcast.
Loudness range (LRA) — appropriate for the material and format. Very low LRA (under 3–4 LU) may indicate over-compression; very high LRA may create playback level inconsistencies depending on the format.
RMS level — useful as a secondary loudness reference, especially for clients or formats that specify RMS rather than LUFS.
Maximum sample value — useful for locating potential clipping. If 0 dBFS, zoom into the reported position in the waveform to assess.
Average value — ideally at or near -∞ dB. A consistent non-zero average value can indicate DC offset that should be checked before export. Microscopic deviations may be insignificant; sustained offset is the concern.
Frequently Asked Questions
Where is Statistics in Sound Forge Pro?
Tools → Statistics in the menu bar. The dialog opens and scans the active file — or the selected region if a selection is active. The scan runs faster than real time, so even long files complete quickly. For delivery verification, deselect any active selection first to ensure the whole file is analyzed.
What does integrated LUFS mean in Sound Forge Statistics?
Integrated LUFS is the average perceived loudness of the entire file measured according to the ITU-R BS.1770 algorithm. It's the primary loudness measurement used by streaming platforms and broadcast standards. For streaming, -14 LUFS is a commonly referenced playback-normalization point — treat it as a reference, not a mandatory mastering target. EBU R128 broadcast targets -23 LUFS; ATSC A/85 targets -24 LKFS. If your file's integrated LUFS doesn't match the delivery target, apply a volume adjustment or normalization pass and run Statistics again to verify.
What's the difference between Statistics and the Normalize scan?
The Normalize scan measures peak and RMS so Sound Forge can apply normalization. Statistics is broader: it reports integrated LUFS, true peak, loudness range, RMS, sample values, DC offset, and zero crossings. Use Statistics first to understand the file's complete state, then Normalize only if the readings show a level adjustment is needed.
Can I run Statistics on a selection rather than the whole file?
Yes. If a region is selected when you open Tools → Statistics, the analysis runs on the selection only. This is useful for checking the noise floor of a quiet section, verifying the loudness of a specific loud passage, or identifying where clipping occurs. For final delivery verification, deselect first so the analysis covers the full file.
What does true peak mean in Sound Forge Statistics?
True peak shows the highest inter-sample peak level in dBTP. It can exceed the visible sample peak because playback and encoding reconstruct the waveform between samples. For streaming-style delivery, many engineers leave a ceiling around -1.0 dBTP. Values above 0.0 dBTP indicate a serious risk of inter-sample clipping during playback or encoding. If Statistics shows true peak above -1.0 dBTP, apply a small limiter pass and verify with Statistics again before exporting.